 Percentage of employees in the three economic sectors 1960-2009
 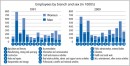 Employed people by branch and sex (in 1000′s) 1991 and 2009
  Employees by occupational group and gender (in 1000′s) 1992 and 2009
Definitions/comments
Classification of occupations by economic sectors.
Sample size: SLFS 1992: 16,921; SLFS 2009: 49,498; weighted data.
Source: SFSO: Employment statistics (ES), SLFS, Swiss wage index; SECO: unemployment statistics.
Print this pageDownload datain Excel format