 Development of divorce rates
  Experienced social loss
  Number of divorces and affected minors
  Wellbeing of the age group 40–65 by marital status
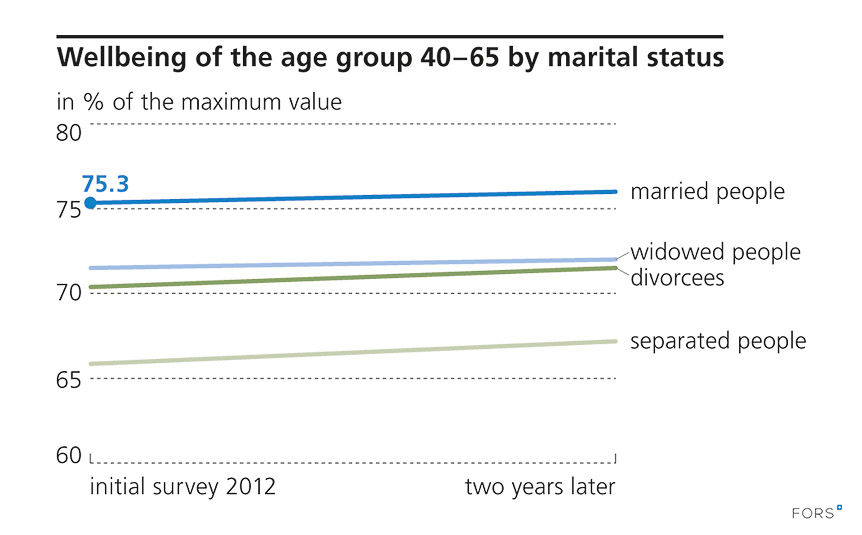
Definitions/Comments:
The values show the percentage share of the maximum value. Example of how to read the chart: On average, during the initial survey in 2012, married people reported a satisfaction value that corresponded to 75.3% of the maximum value (i.e. on a scale between 0 and 10, the average satisfaction value was 7.53).
Sample size: LIVES IP12 2012: 2813, 2014: 2156
Source: NCCR LIVES IP212
Print this pageDownload datain Excel format